


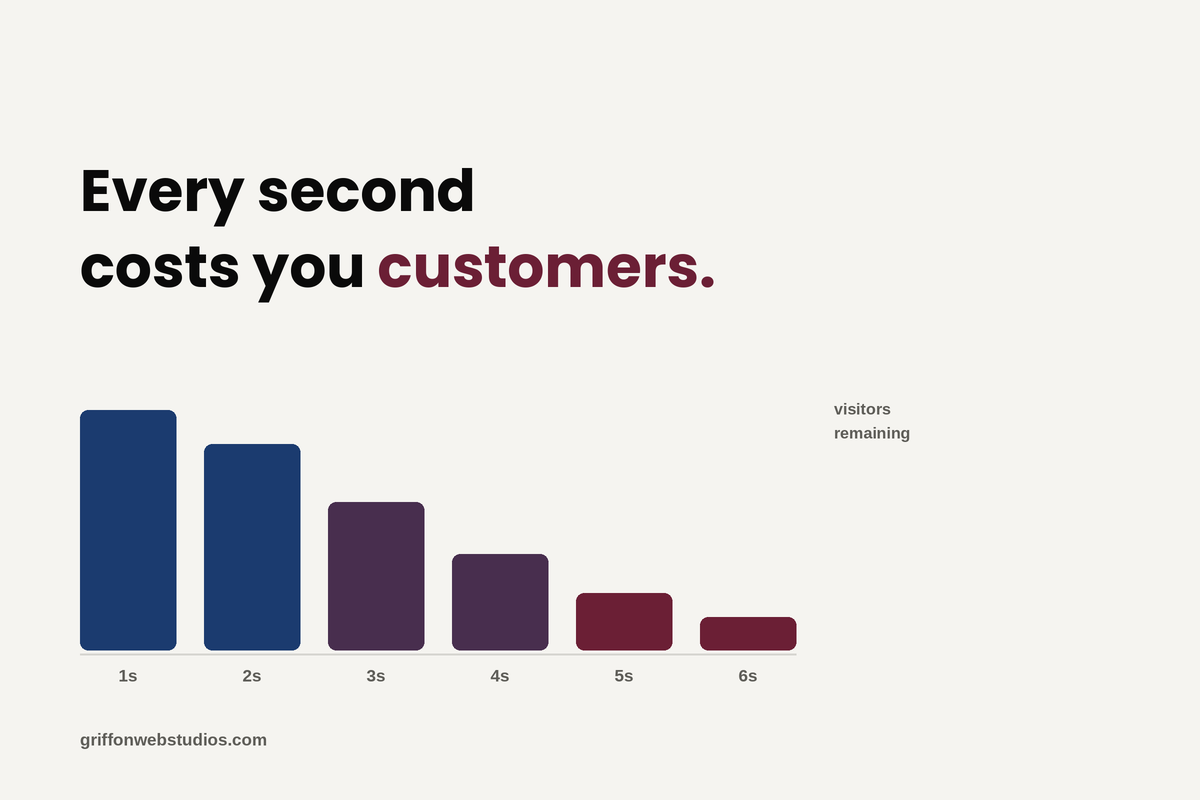
Ask a business owner about site speed and you get a shrug. Ask them about losing half their prospects before the page finishes loading and you get a different conversation. Those are the same conversation. Core Web Vitals is the name Google gave to a set of measurements, and because it sounds technical, it lands on a developer’s task list and stays there, competing with features that feel more urgent. The framing is the problem. These are not developer metrics. They are a measurement of how many people give up on your business before they have seen anything you offer.
This article is about the money, not the code. What the metrics actually measure, what the evidence says they are worth, how to work out the cost for your own business, and how to decide whether fixing it is worth what it costs.
The three metrics, in plain terms
Google measures three things about the experience of a real visitor loading a real page.
Speed: The first is how long it takes for the main content to appear. Not the first pixel, not a spinner, but the thing the visitor actually came to see: the headline, the hero image, the product. Google calls this Largest Contentful Paint, and the threshold for a good experience is 2.5 seconds.
Engagement: The second is how quickly the page responds when someone interacts with it. They tap a button, open a menu, start typing, and the page either reacts immediately or sits there. Google calls this Interaction to Next Paint, and the threshold is 200 milliseconds. This one replaced an older responsiveness metric, and plenty of sites that comfortably passed the old one fail this one, because it measures the full interaction rather than just the first moment of it.
User Experience: The third is whether the page holds still. Content loads in stages, and if a late-arriving image or ad shoves everything down the screen, the visitor loses their place or taps the wrong thing. Google calls this Cumulative Layout Shift, and the threshold is 0.1.
Two details matter for interpreting your own numbers. Google grades you at the 75th percentile, meaning three quarters of your visits must meet the threshold, so a good average can still be a failing grade. And it grades on field data collected from actual Chrome users rather than on a test you run yourself, which is why a flattering score in a speed testing tool can coexist with a failing assessment. Your visitors’ phones and networks are the measurement, not your office wifi.
What the evidence actually shows
The most reliable numbers come from businesses that ran controlled tests rather than from vendors selling optimization. Google maintains a collection of these, and the pattern across them is consistent enough to be useful even though the magnitudes vary wildly by industry.
Rakuten’s Japanese storefront ran an A/B test between an optimized landing page and the original, identical in every other respect, and reported a 53.37% increase in revenue per visitor and a 33.13% increase in conversion rate on the optimized version. That is a large number from a large site, and no small business should expect to replicate it. What travels is the direction and the mechanism, not the multiple.
Google’s own collection of business impact case studies shows the same shape repeatedly across different industries: measurable improvements in conversion, engagement, and revenue following performance work. Notably, several report gains in the low single digits to low double digits rather than in the fifties, which is the more realistic expectation for most businesses.
Two things are worth being careful about here. Numbers in this space get inflated and repeated without sourcing, and a meaningful share of what circulates traces back to studies on enormous ecommerce sites where a fractional percentage is worth millions. Correlation is also doing some work in these studies: faster sites often belong to companies that invest more in everything, so not all of the gain is attributable to speed alone. The honest version of the claim is that performance improvements reliably move conversion in the right direction, that the effect is larger on mobile and on ecommerce than elsewhere, and that anyone promising you a specific percentage before looking at your site is guessing.
Working out what it costs you
You do not need industry benchmarks to price this. You need four numbers you already have.
Take your monthly visitors, your current conversion rate, your average value per conversion, and your close rate if you sell a service rather than a product. That gives you the revenue your site produces now. Then model a conservative improvement, say a one to two percentage point lift in conversion rate rather than a fifty percent one, and rerun the arithmetic. The difference is your annual opportunity, and for most businesses it is dramatically larger than the cost of the work.
For example, A service business gets 5,000 monthly visitors, converts 2% into inquiries, closes a third of those, and averages $3,000 per job. That is 100 inquiries, about 33 jobs, roughly $99,000 in monthly revenue. Move the conversion rate to 3%, which is a plausible outcome of removing real friction rather than an aggressive one, and you get 150 inquiries, 50 jobs, and about $150,000. The gap is meaningful, it recurs every month, and it exists whether or not anyone ever fixes it.
Run this with your own numbers before you commission any work. It tells you both whether the project is worth doing and how much it is rationally worth paying for.
Why the mobile number is the one that matters
Most of your traffic is on a phone, on a cellular connection, often on a device several years old. Your website looks fast to you because you are testing it on good hardware and a fast connection, frequently with the page already cached. That experience is not representative of anyone else’s.
This is also where the gap between test scores and reality opens up. A testing tool runs a simulation on a specified connection and gives you a lab score. Google’s assessment uses field data from real Chrome users on real devices. When those two disagree, the field data is the one that describes your customers. A green score in a speed test and a failing Core Web Vitals assessment can be true simultaneously, and if you only ever look at the score, you will conclude the problem is solved when it is not.
What the ranking effect really is
Google has said clearly that page experience is a ranking consideration and equally clearly that it is not a dominant one. Content relevance and quality matter far more. The practical read is that Core Web Vitals behaves like a tiebreaker: when two pages are otherwise comparable, the better experience has an edge.
That should change how you value the work but not whether you do it. If you are pursuing performance purely for rankings, you are chasing the smaller of the two prizes and you will probably be disappointed. The conversion effect on the visitors you already have is the larger and more immediate return, and it arrives in days rather than the months a ranking shift would take. Search visibility and on-site conversion are different jobs, and performance work pays into the second one first.
Where the time actually goes
Most slow sites are slow for a short list of reasons, and none of them are exotic.

Oversized images are the most common single cause, particularly on WordPress sites where full-resolution uploads get displayed at a fraction of their size. Modern formats and correct sizing frequently solve the largest share of the problem on their own.
Plugin and script accumulation is the second. Every tracking tag, chat widget, popup tool, and abandoned plugin costs something on every page load, and almost nobody audits what is still installed. Third-party scripts are also the usual culprit behind poor interaction responsiveness, because they occupy the browser precisely when a visitor is trying to do something.
Cheap hosting shows up as slow server response, which delays everything downstream no matter how well the rest of the page is built.
Heavy themes and page builders load large amounts of code for features a given page never uses.
And layout instability almost always comes from images, ads, or embeds that arrive without reserved space, plus web fonts that swap in late and reflow the text.
The order matters. Images and hosting usually deliver the largest gains for the least money, and it is worth exhausting the cheap fixes before anyone proposes a rebuild.
Deciding whether to fix it
The decision is a straightforward comparison once you have run your own numbers. Compare the annual revenue opportunity from a conservative conversion improvement against the cost of the work. For most small and mid-sized businesses, image optimization, a plugin audit, and better hosting land well under the value of a handful of additional jobs a year.
Two cautions. Diminishing returns are real: getting from awful to good is where the money is, and getting from good to perfect is usually a poor use of budget. And if you are planning a redesign anyway, handle performance as part of that project rather than paying twice, because a redesign is also the moment performance most often regresses when a heavier theme ships without anyone checking.
The Vital Point
Core Web Vitals is not a technical scorecard to satisfy Google. It is a measurement of how many people your website loses before it has a chance to sell anything, and it has a dollar value you can calculate from numbers already sitting in your analytics. Calculate it. If it is small, deprioritize the work honestly. If it is large, you now know what you are losing every month you leave it alone.