Technology has become the backbone of almost everything we do in our daily lives. This is from agriculture, business, education, government systems and creative arts just to mention a few. The growth in technology has led to the introduction of new products and business processes.

Online shopping has been one of the introduced technologies. Most of the businesses if not all, have adopted this technology just to increase their networks, market and getting customer feedback to improve their products. It provides a platform where businesses engage themselves virtually directly with their customers. Here are some of the statistics and trends in online shopping.
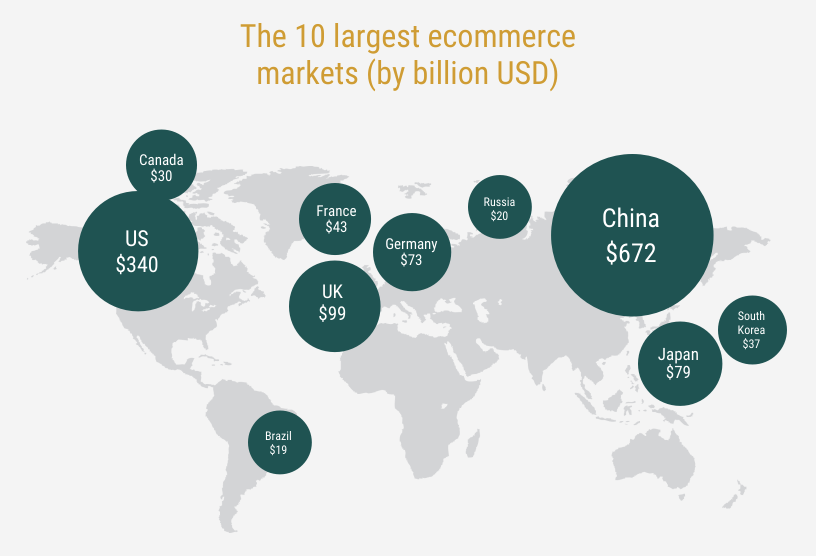
E-commerce Statistics
E-commerce is growing at the rate of 11.9% annually-up from 3.9% a decade ago. The millennial’s desire to get instant and quick access to products has contributed a lot to this growth. There are 80 million of them in the US. They spend $600 billion annually and that’s 28% of all daily per-person consumer spending. They are forecasted to be 35% of spending by 2030.
 Retailers should now able to keep track of the growing number of users and also set effective measures in driving sales.
- By 2040, it is thought 95% of purchases will be facilitated by eCommerce (Nasdaq)
- 54% of the online purchases are done by millennials.
- 71% of Shoppers Prefer Online Stores.
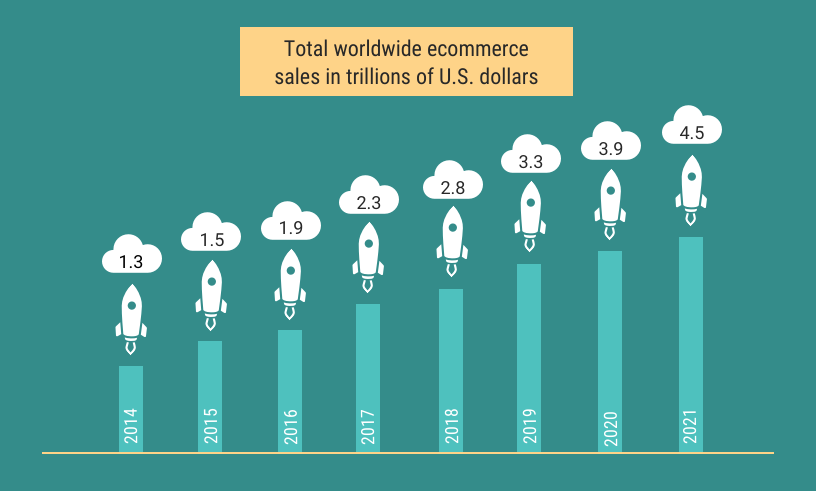
- Retail E-Commerce Sales will Grow to $4.5 Trillion by 2021.
- 35% of Online Shoppers Start with Big E-Commerce Marketplaces.
- 56% of online shoppers abandon their online basket because they were presented with unexpected costs at the checkout
- 52% of people say they’re less likely to re-engage with a brand following a bad mobile experience (Google)
- Email accounts as the biggest source of traffic to eCommerce sites after organic (SocialMediaToday)
Curated and Subscription statistics
- 23% of shoppers will abandon their shopping basket if they are forced to register an account.
- By 2020, personalization technology that recognizes customer intent will enable digital businesses to increase profits by up to 15%
- A staggering 35% of Amazon’s revenue is generated by its recommendation engine
- The average order value (AOV) of purchases from basket abandonment emails is 14.2% higher than typical purchases.
- 74% of customers feel frustrated when website content is not personalized.
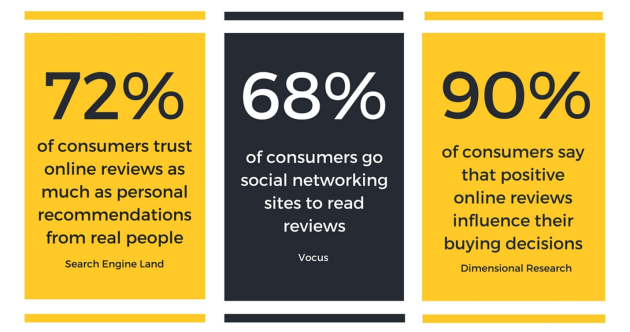
Customer reviews statistics
- It only takes 1-3 negative review for an online buyer to make their decision whether to buy the product or not.
- 70% of potential customers are lost if there are 4 or more articles talking negatively about your company or products.
- 40% of online buyers create an opinion of a company or business just only after reading 1 to 3 customer reviews.
- 48% will visit a company’s website after reading positive reviews.
- Reliability (27%), expertise (21%) and professionalism (18%) remain the most important attributes to consumers.
- Reviews produce an average of 18% uplift in sales.
- At least 55% of shoppers agree that online reviews influence on whether they make a purchase or not
- About 88% of consumers agree that they trusted reviews made online as much as they did personal recommendations.
- Reviews of a business can impact it up to 10% in the search rankings.
- Only 72% of buyers make a purchase upon reading a good review.
- It’s 7 times more expensive to get a new customer than retain an existing one.
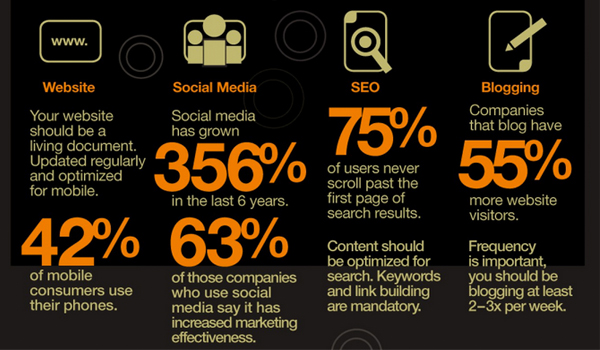
Social media Statistics
- 48 percent of Americans have interacted with companies or institutions on at least one social media network.
- 23% of online purchases are through social media.
- 51% said that they would unfollow brands on social media if they posted irritating posts and 27% said they would mark/report the brand and page as spam and block them.
- Facebook still reigns supreme as the most popular social media network, with 79% of internet users in the US logging on the site.
- Facebook videos were 109% higher than on YouTube videos.
- Instagram ads grew by 28% in the second half of 2017.
- Instagram drives the most engagement per post compared to any social network – 84 times more than Twitter, 54 times more than Pinterest and 10 times more than Facebook.
- 47% of marketers agreed Twitter was the best social media channel for customer engagement.
- 94% B2B organizations rely on LinkedIn for content marketing and distribution.
- More than 400 million Snapchat stories are created per day.
Marketplace Statistics
- Amazon was the most popular marketplace with a total score of 6.12 on a 10-point scale. (Statista)
- Only 63% sell on marketplaces.
- 55% sellers have a profit margin above 20%. Profit margins on Amazon and eBay are almost identical.
- 29% are not satisfied with their channel management tool.
- 36% of people begin their search in a marketplace.
Mobile Statistics
- Users spend on average 69% of their media time on smartphones.
- Mobile devices will drive 80% of global internet usage.
- 69% of consumers worldwide between the ages of 18 and 39 use mobile devices to research products before they buy. (Aumcore)
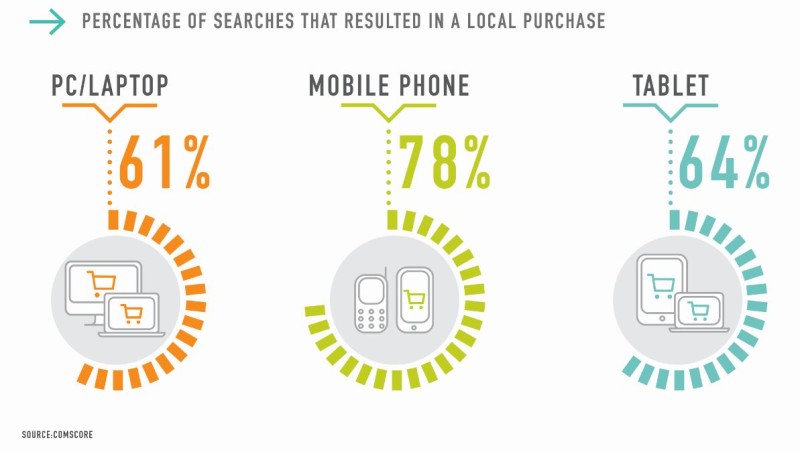
- 78% of mobile searches for local business information result in a purchase. That’s higher than from any other kind of device. (Comscore)
- Mobile-influenced offline spending is already over $1 trillion. People do heavy mobile research before indulging in offline purchasing in almost all categories. (Forrester)
- 57% of users say they won’t recommend a business with a poorly-designed mobile site. (Socpub)
- It’s estimated that US mobile search spending will reach $25.11 billion in 2018 and $28.25 billion in 2019. (Aumcore)
- By 2019, mobile advertising is expected to represent 72% of all U.S. digital ad spending. (Marketingland)